A light stayed off even though your automation should have turned it on. Did the trigger never fire, did a condition stop the run, or did the action reach an unavailable device? Changing several settings at once makes that harder to answer.
This guide walks through a fictional hallway-light example using Home Assistant’s trace and activity tools. By the end, you should be able to find the relevant run, identify where it stopped, and choose a focused next check. The workflow follows the official documentation for Home Assistant 2026.11.2; the Activity filter and links between related traces described below are available in the 2026.11 release.
Before you start
You need an existing automation, access to its editor and traces, and an approximate time when the problem occurred. The example assumes motion should turn on a hallway light only after sunset. Your triggers and conditions may be different. No additional integration or custom card is needed.
For this investigation, start with a real recorded run. Run actions skips the automation’s triggers and top-level conditions, so a successful manual run does not prove that the normal trigger and conditions work. Running actions can also control real devices; use it only when safe. Home Assistant documents this distinction in its automation testing guide.
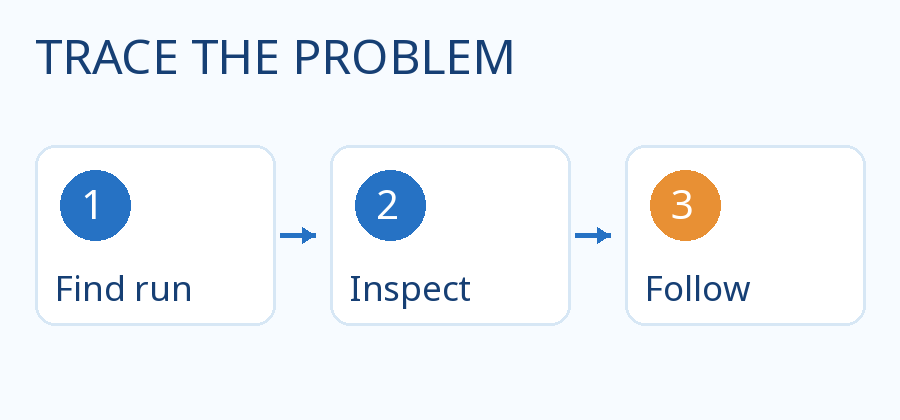
1. Find the run closest to the problem
- Go to Settings → Automations & scenes and open the automation. Select Traces in the editor’s top bar. On a narrow screen it may be in the menu.
- Choose the run near the time the light should have turned on. Check the time and how the run ended; do not assume the newest run is the one you need.
- If there is no matching run, check whether the automation was enabled and whether its trigger saw the expected change. A missing trace is a lead, not proof of one particular failure.
By default, Home Assistant keeps the last five traces per automation. A busy automation can replace the one you wanted. YAML automations need an id for traces; unexpected shutdowns can also lose recent traces. The trace documentation explains retention and how to increase it.
2. Follow the path through the trace
In the trace graph, select each step along the highlighted path and read Step details. The timeline helps connect the sequence to the time of the problem. Look for the first point at which the run differs from what you expected:
- A condition stopped the run: select that condition and inspect its result. In our example, the motion trigger may have worked while the after-sunset condition was false. Check the condition and the relevant state at the time before changing it.
- An action stopped on an error: select that action and read the error. Check the target, required values, and device availability. An error identifies the failed step; it does not always explain the underlying network or device problem.
- The run finished but the light did not change: inspect the action anyway. A target can contain no matching entities, or an unavailable device may not respond. An action set to continue on error can also leave a failed step inside an otherwise finished run.
For these cases, see the official automation troubleshooting reference. Fix only the issue the evidence points to, then observe another real, safe run and compare its trace with the earlier one.
3. If the run calls a script, follow the script too
An automation may call a script that contains the actual light action. In 2026.11, related activity can link to the trace of the specific script run. Open the script’s View trace link when available and inspect its own condition and action steps. A successful call into a script is not by itself evidence that every later action had the intended physical effect.
4. If something changed unexpectedly, start from Activity
Open the affected entity and inspect its Activity around the relevant time. In 2026.11, the Triggered by filter can narrow activity by people, automations, scripts or integrations. Select a relevant entry to inspect its recorded cause; when a retained trace is available, follow View trace. The 2026.11 release notes describe the filter and linked traces.
If the cause is unknown, check the device’s own app, physical controls, schedules and other integrations. “No cause recorded” is not proof that a particular person or integration caused the change.
How to know you have found the problem
Write down the run time, the first unexpected trace step, and what its details show. For the hallway example, a condition marked false when you expected it to pass is a specific observation; “the automation is broken” is not. After a targeted correction, check a later real run and confirm both the trace path and the actual device result. If they disagree, investigate the device or integration rather than assuming the command succeeded physically.
Traces and downloaded logs can contain entity names, locations, webhook data and secrets. Review and redact them before sharing; the official guide includes a preparation checklist.
Validation: The workflow and 2026.11 features were checked against the official release notes and documentation. The hallway scenario and diagram are illustrative; no household automation was run or changed for this article.
Related: monitor a sensor that becomes unavailable.